Labor Intelligence
40% of contentThe core differentiator. Nobody else talks about this.
Real-time labor cost data, industry benchmarks, and ratio analysis that gives F&B operators the insight edge. Every stat card, every benchmark, every data point is designed to make operators think "I need to check my numbers."
Why This Pillar Matters
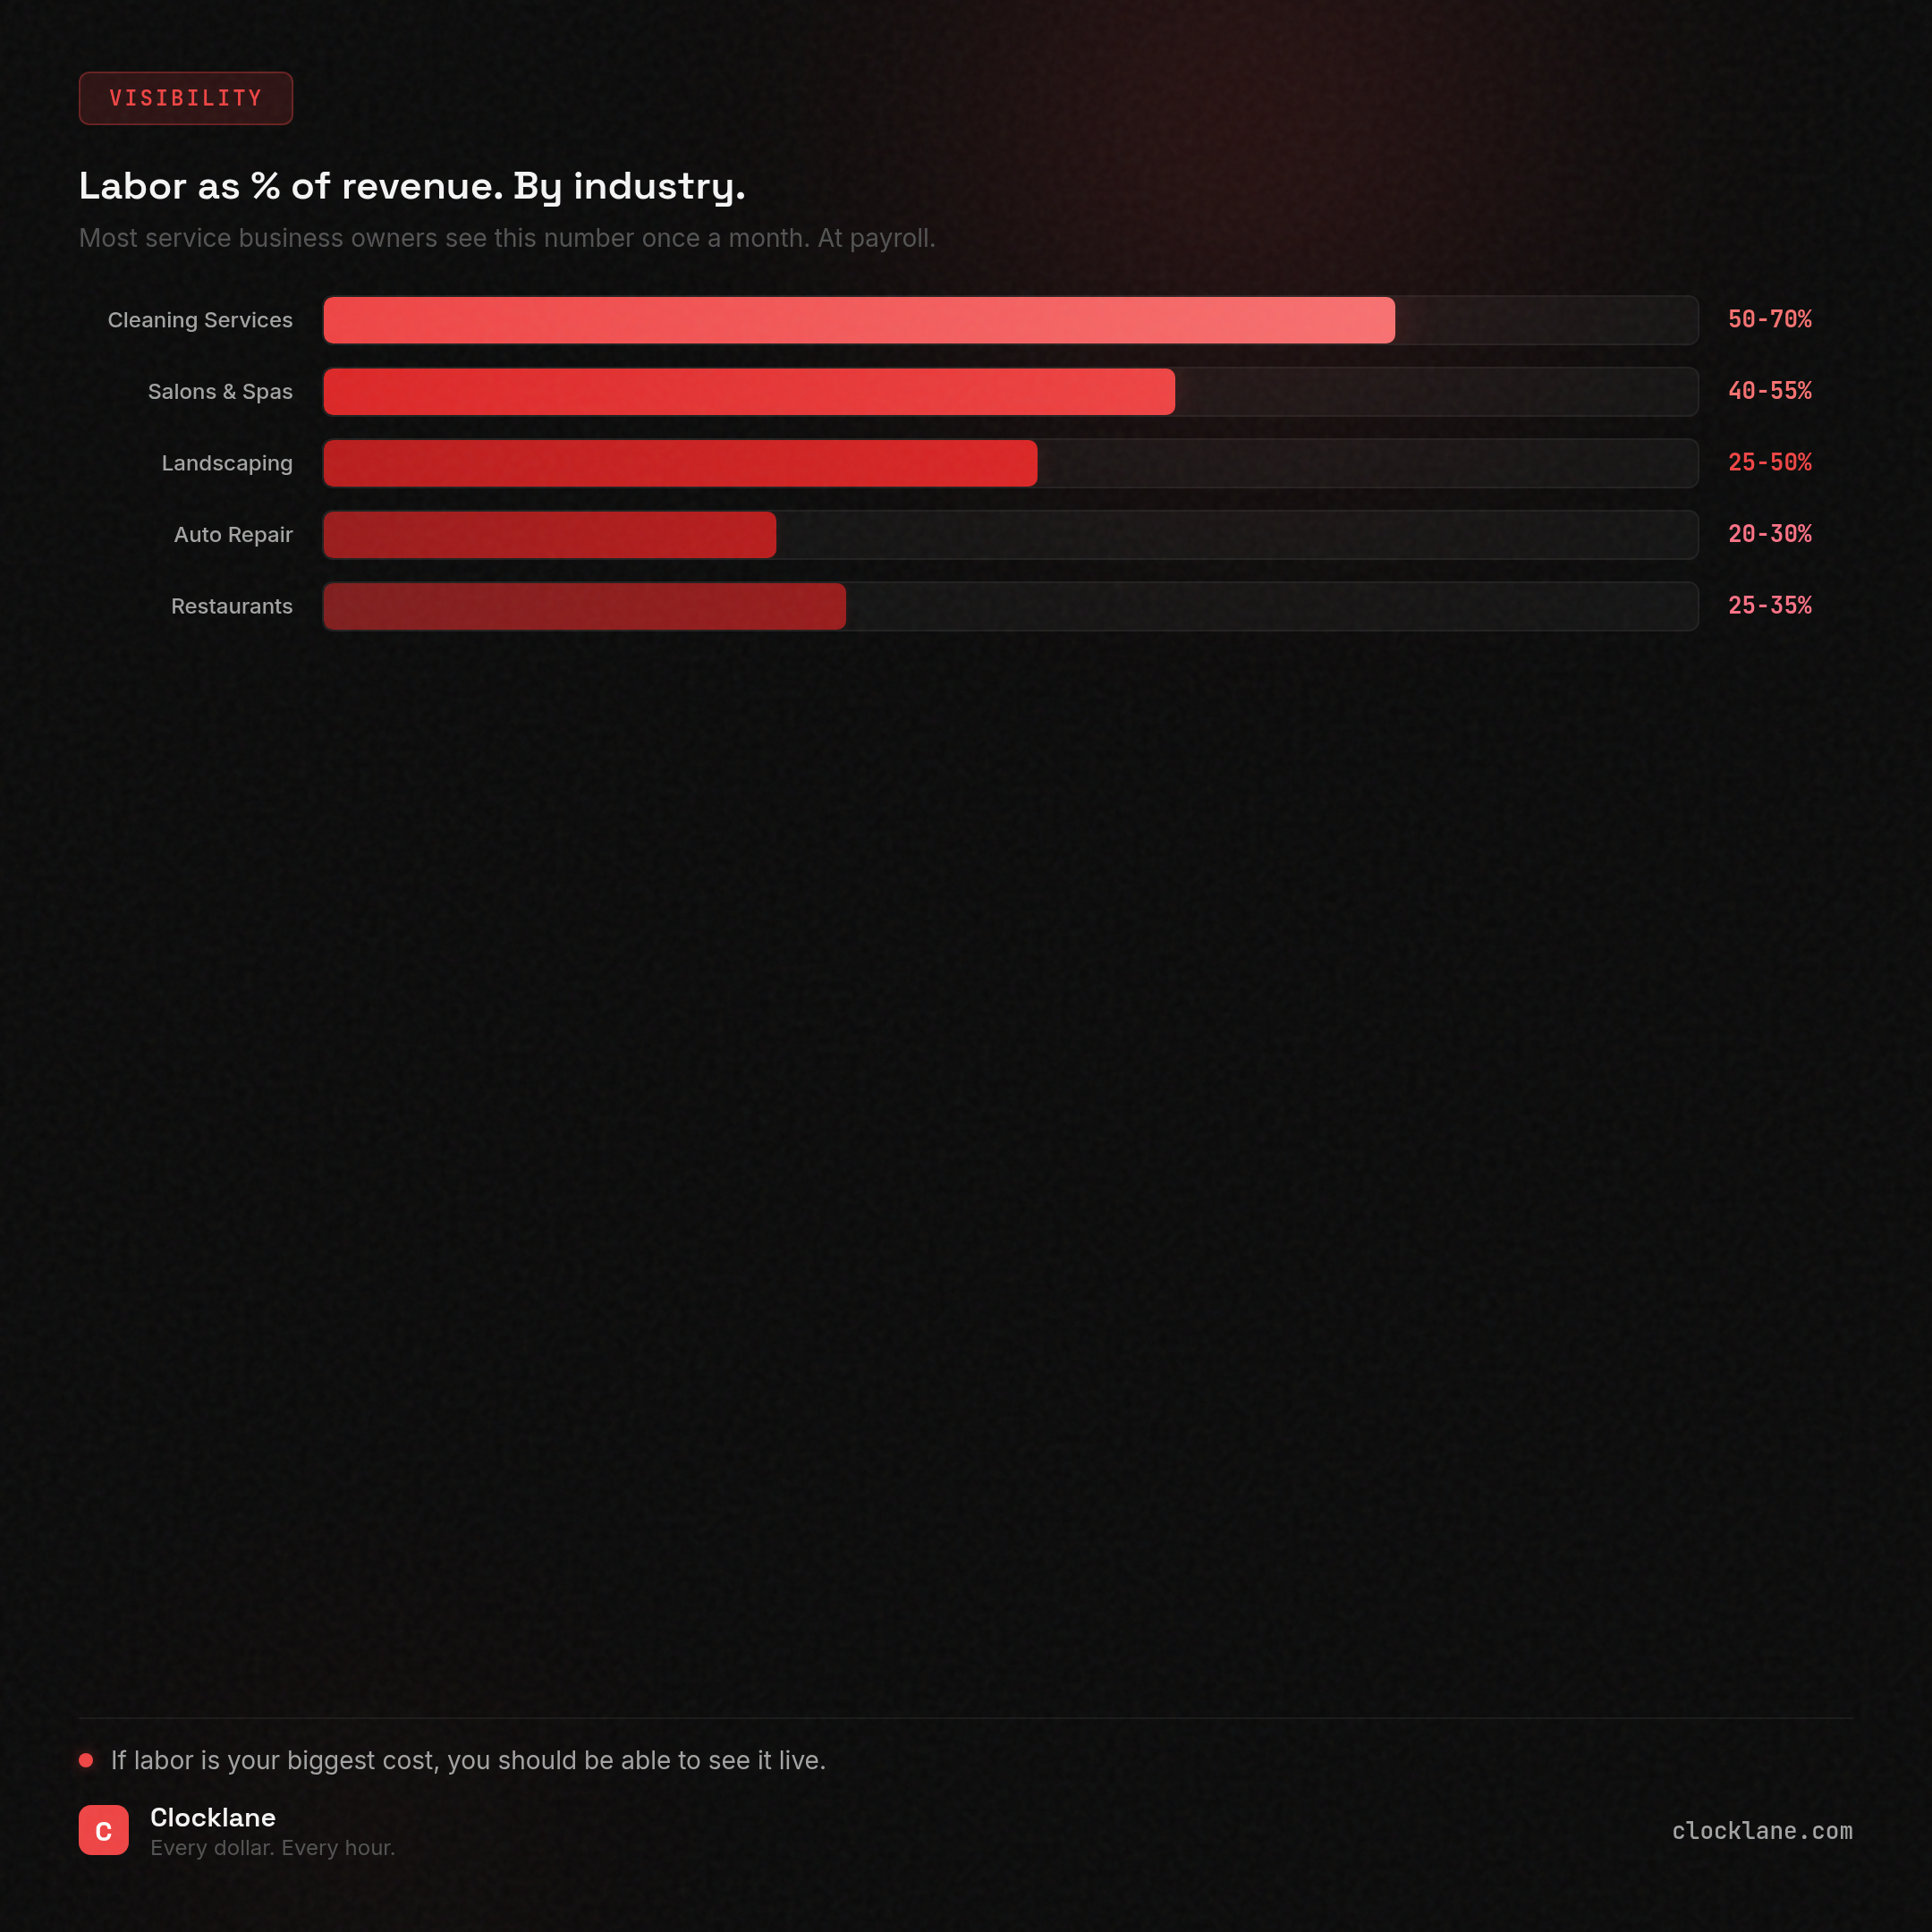
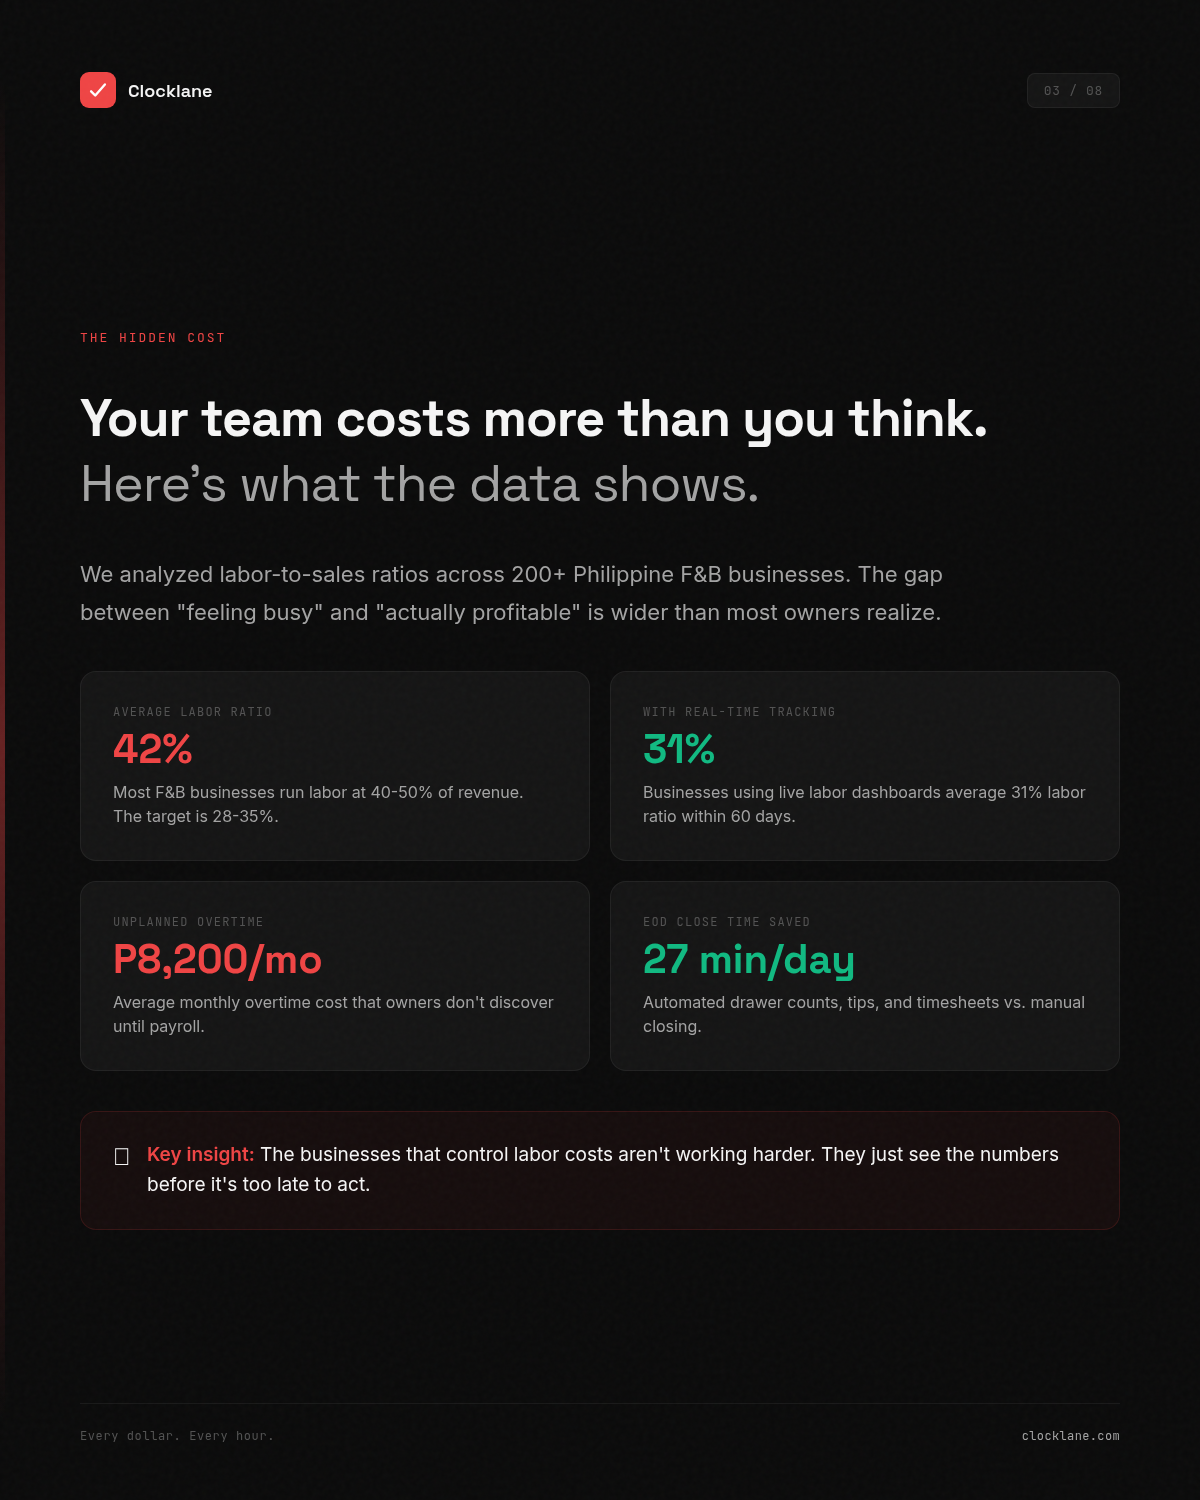
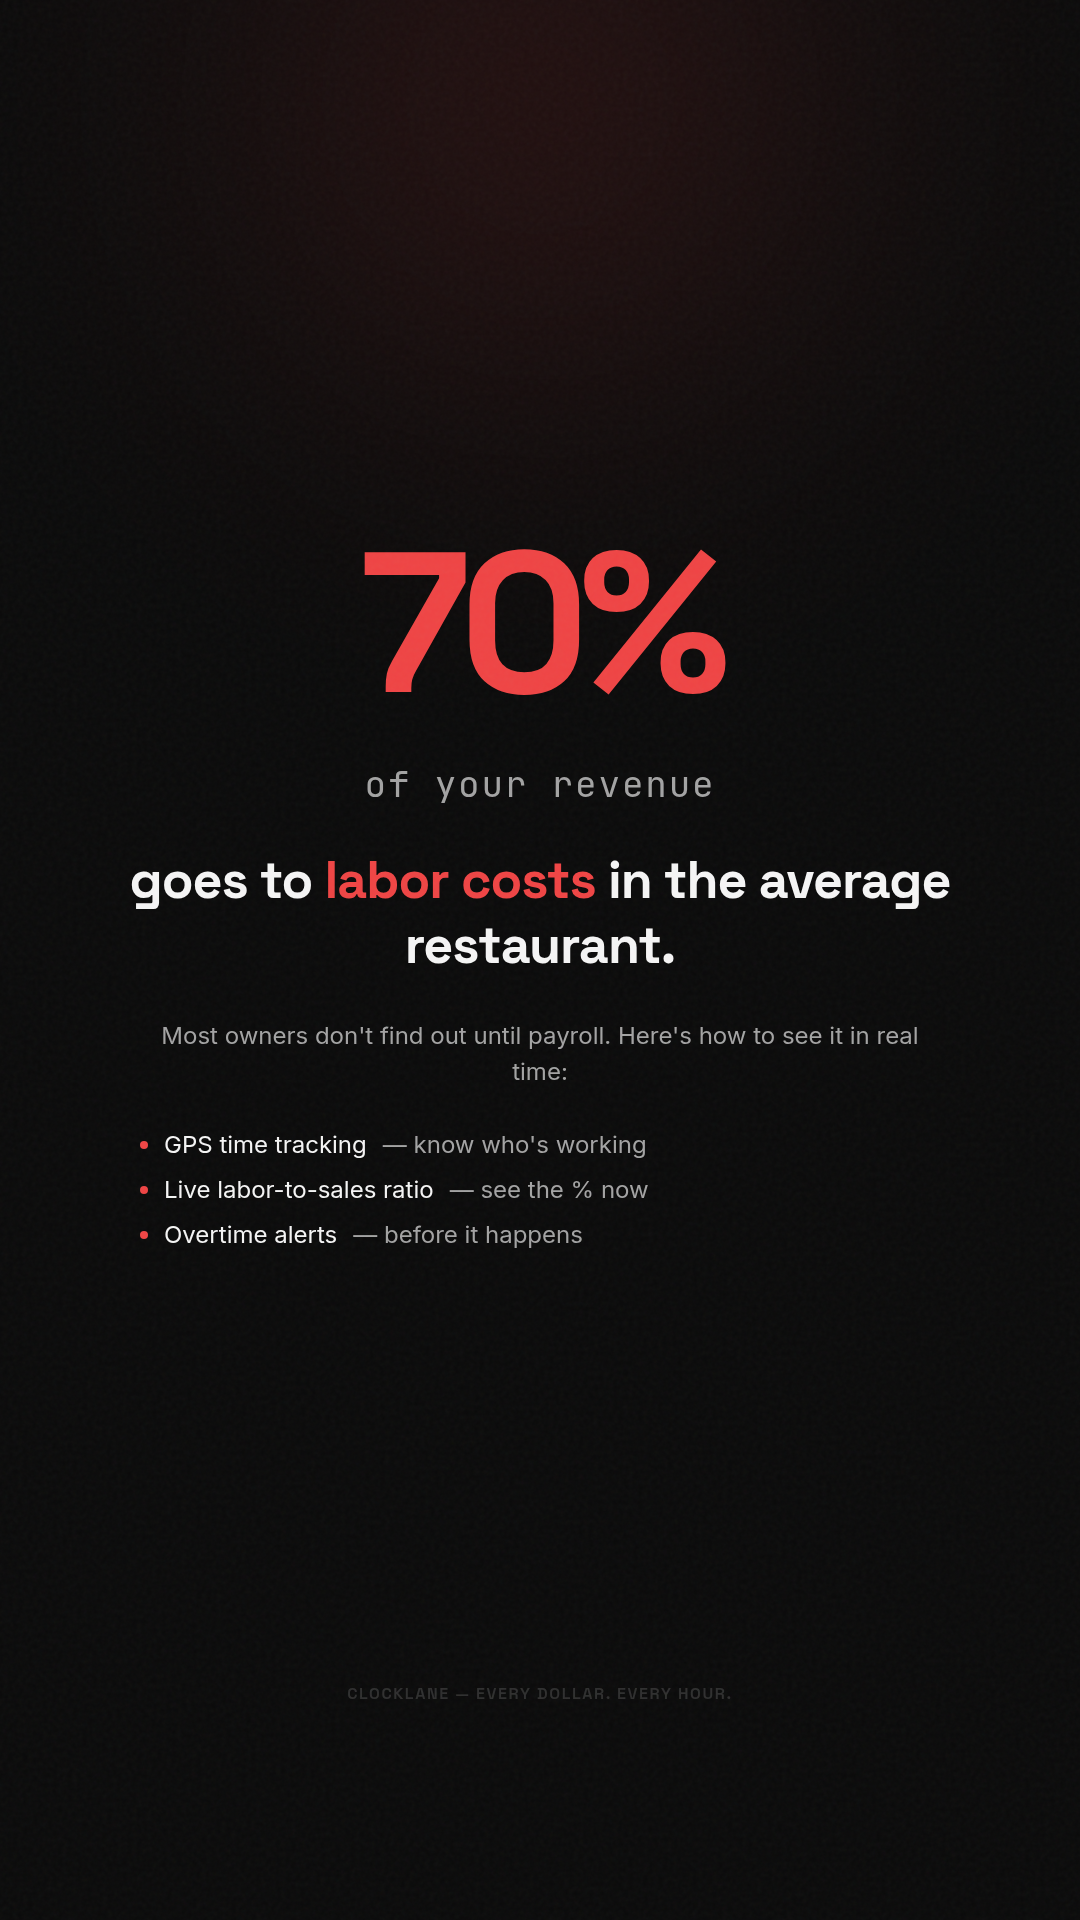
Labor is the #1 controllable cost for F&B operators (25-35% of revenue)
Most operators have no idea what their actual labor-to-sales ratio is
A 5% improvement in labor efficiency can double profit margins
Data-driven content builds credibility and positions Clocklane as the authority
Sample Content
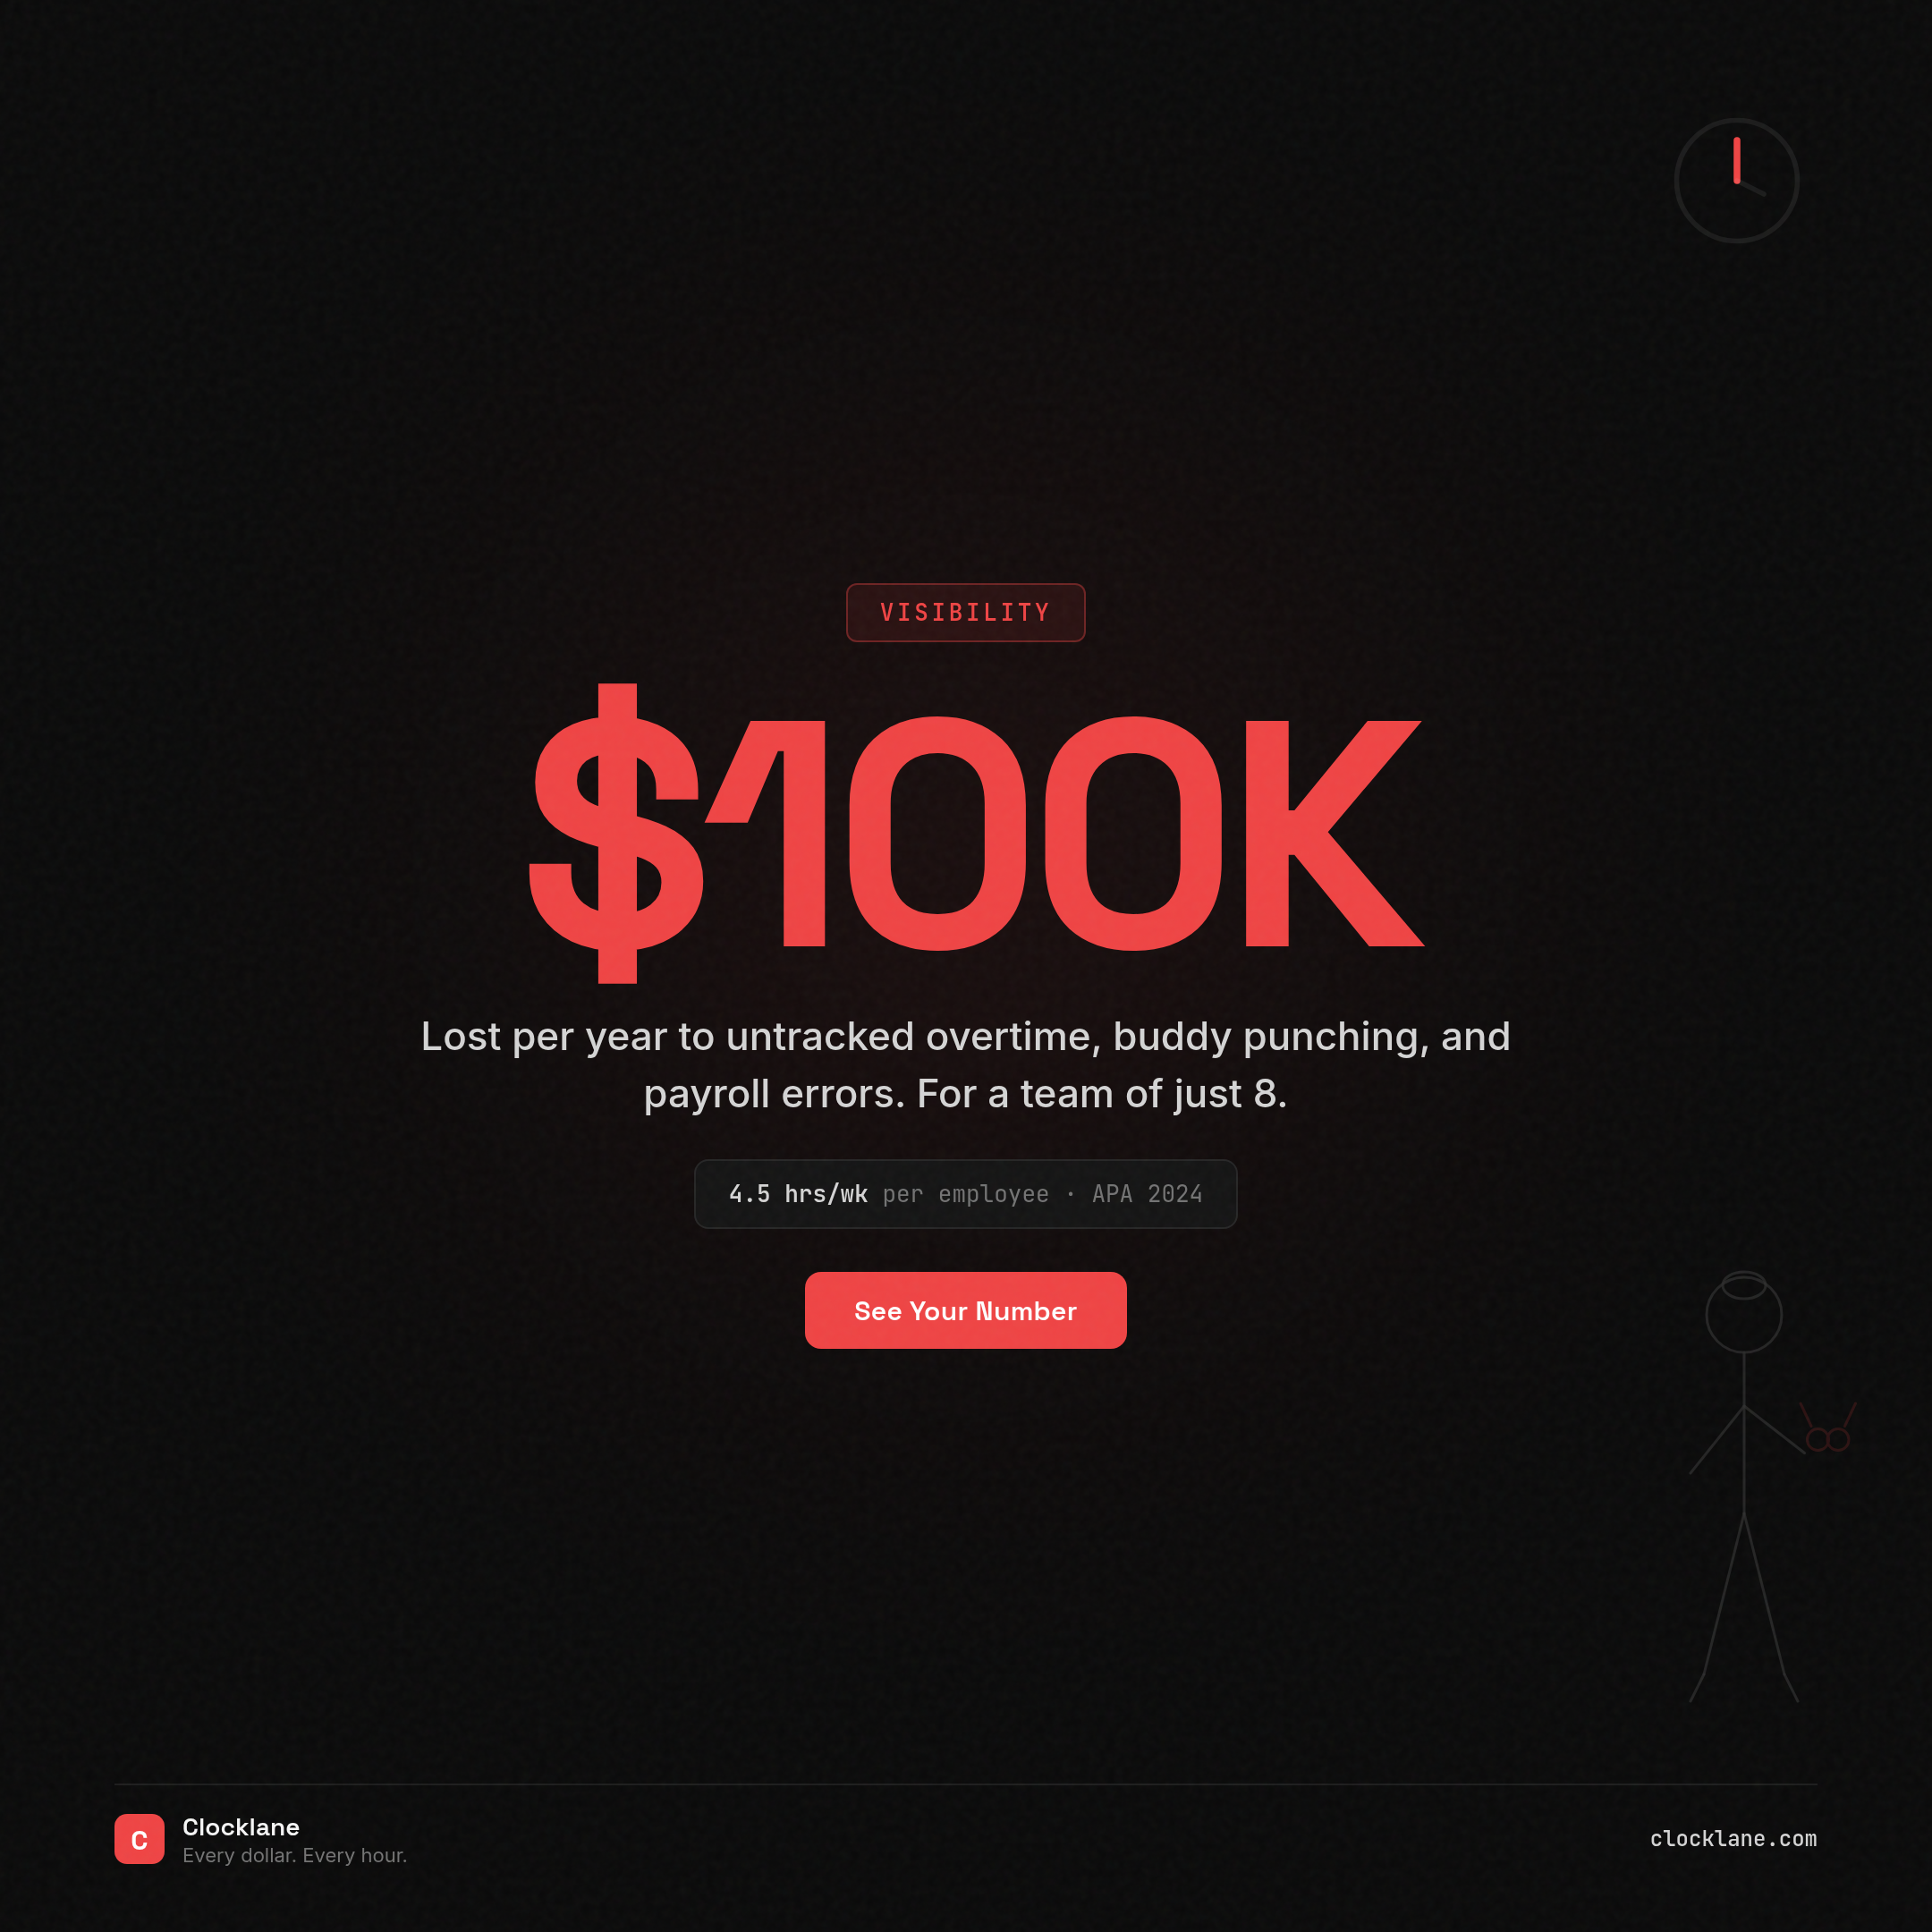
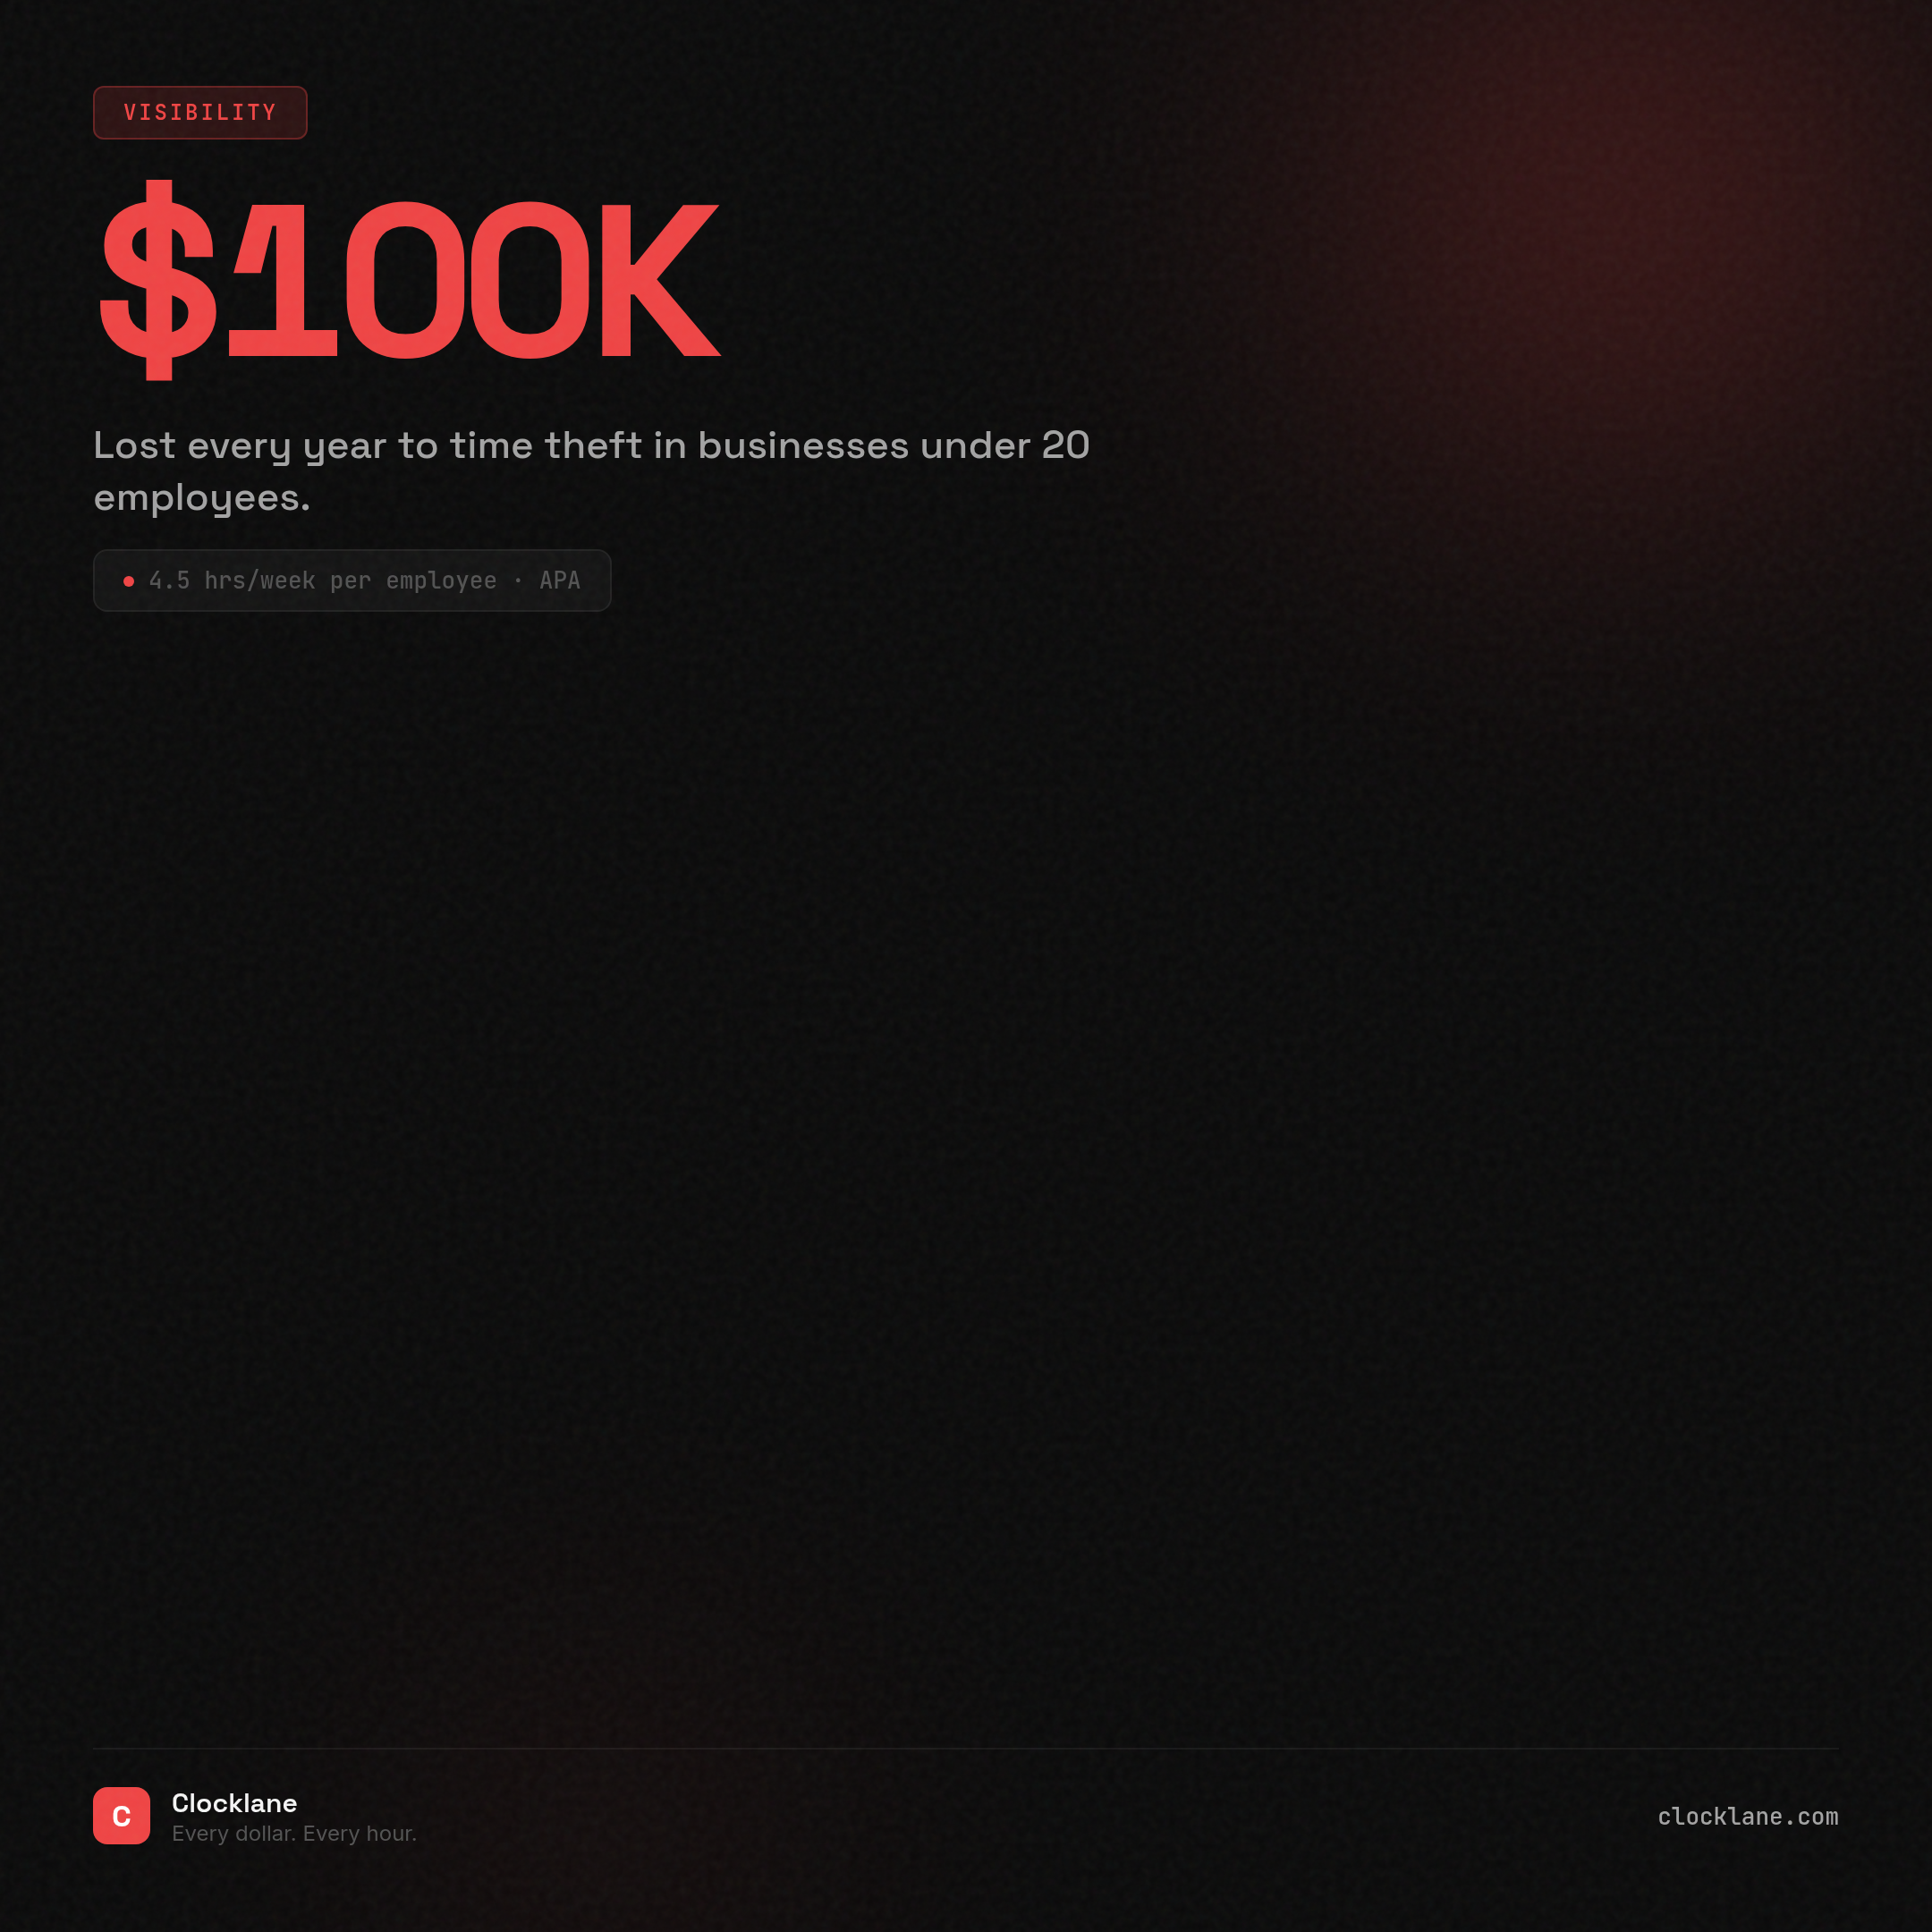
$5,246/yr lost per employee to time theft
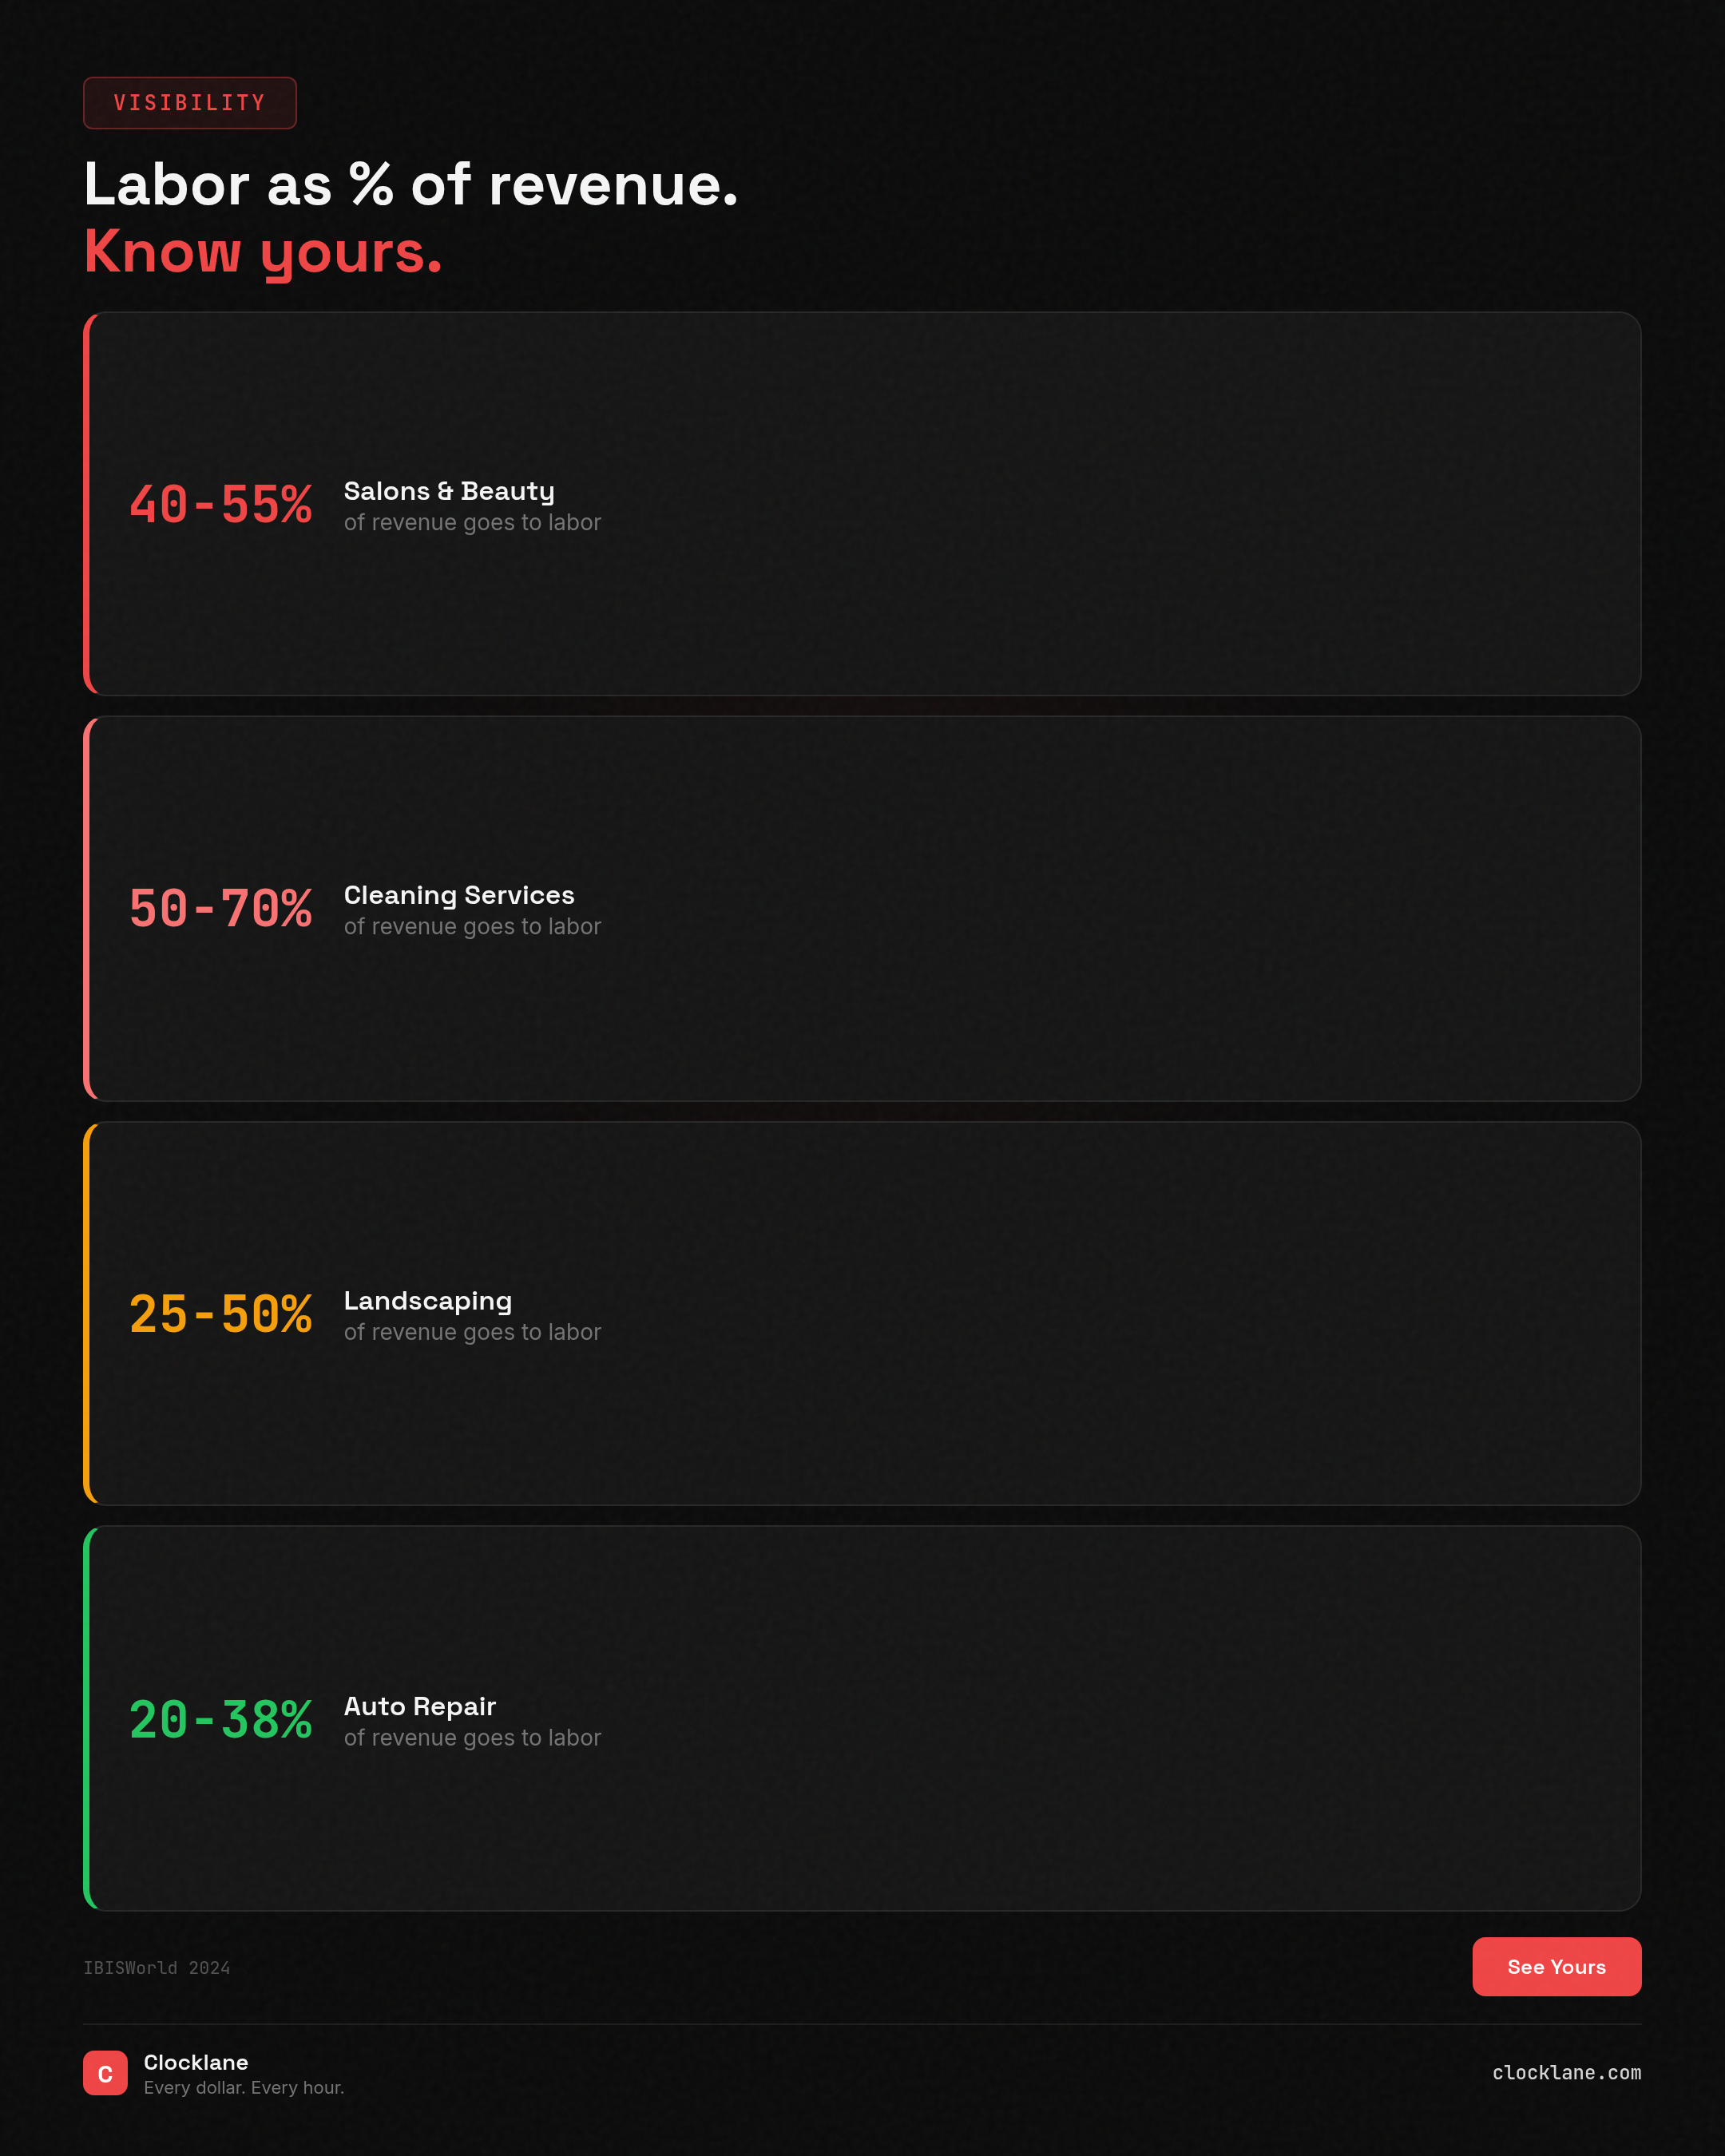
APA 2024Salons: 45% | Cleaning: 55% | F&B: 35%
BLS 202568% labor ratio? Your margins are gone.
NRA 2024Template Gallery
Templates in This Pillar
Stat Card
Bold statistic with context and source attribution
Industry Card
Vertical-specific labor benchmarks
Stat Card (v1)
Original bold stat format
Curated Stat Card
Stat with editorial context and insight
Benchmark Card
Industry benchmark comparison
PAS Carousel (v1)
Problem-Agitation-Solution framework, square format
LinkedIn Data Carousel
PDF-style data carousel for LinkedIn document posts
TikTok Stat Carousel
Bold stat drops for TikTok Photo Mode
Facebook Comparison Carousel
Square comparison cards for FB feed
X/Twitter Data Carousel
Horizontal data cards for X/Twitter
Phase 1 Stat Card
Cold audience stat hooks for awareness
Phase 1 Benchmark Card
Industry credibility data for awareness